
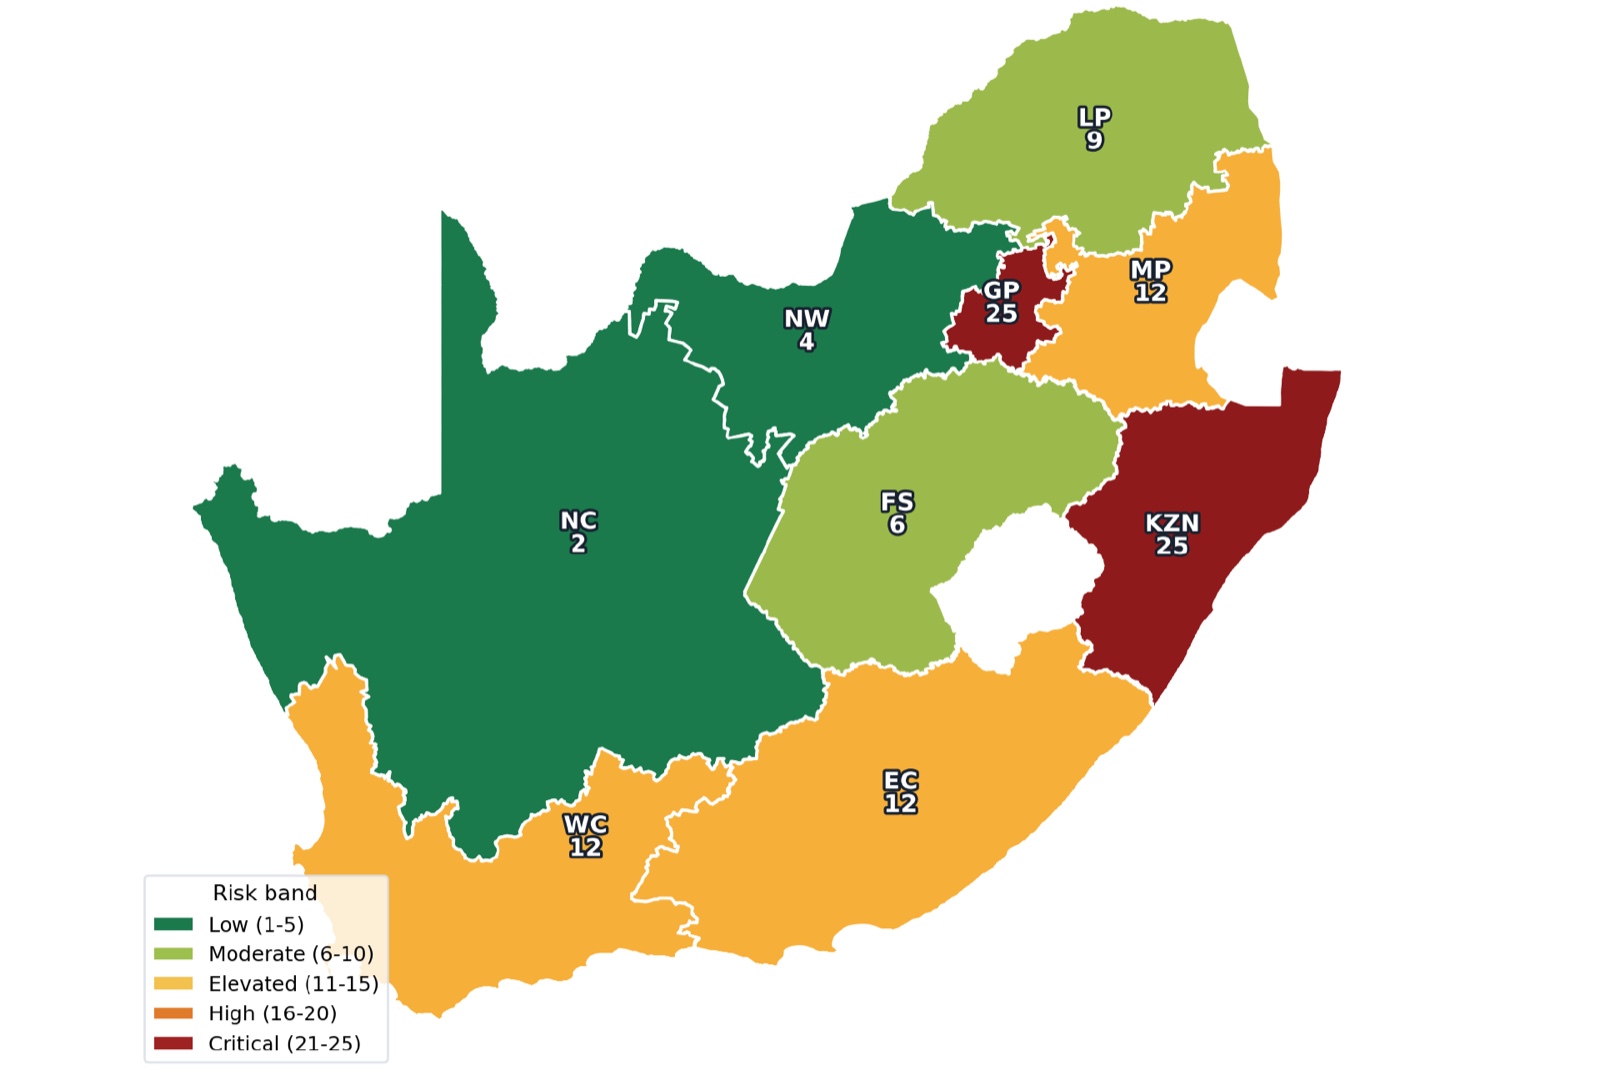
In June 2026, an anti-illegal-immigration coalition led by the movement known as March and March called a national shutdown for 30 June, backed by an ultimatum and the memory of July 2021 — nine days that cost roughly 354 lives and R50 billion. Unlike our anonymised engagements, this work is public: Gray Guardians published its national risk assessment a week ahead of the event and operated a live provincial risk dashboard as the day unfolded. Both remain available on this site.
The challenge
Organisations across the country faced the same three questions: how likely was a genuine national shutdown, where would the risk actually land, and what should be done before the deadline rather than after it. Public commentary offered either alarm or reassurance — neither of which is a plan. What was missing was a quantified, province-by-province view that boards, security teams and community leaders could act on with a week's lead time.
Our approach
On 23 June we published a probabilistic national risk assessment built on four weighted scenarios, from a contained protest to a systemic, 2021-scale event. The assessment graded all nine provinces, named the eThekwini–Johannesburg–Ekurhuleni triangle and the N3 and N2 corridors as the decisive terrain, benchmarked the downside against July 2021, and set out phased recommendations with personnel safety ahead of asset protection throughout.
- A four-scenario probabilistic model with explicit likelihood weightings and indicative economic impact
- Provincial risk grading across all nine provinces, with the N3 and N2 treated as red routes
- Phased organisational recommendations — protect people, pre-position, confirm SASRIA cover, stand up a common operating picture
- An open web summary with gated full-report downloads, published seven days before the event
- A live provincial heatmap — flashpoint nodes, escalation tracking and response checklists — updated as the event unfolded
When 30 June arrived, the assessment moved from forecast to live operation. The dashboard tracked seventeen flashpoint nodes across the country in near real time, graded each province against the published scenario bands, and carried action checklists for authorities, businesses and residents — a common operating picture available to everyone who needed one.
The outcome
The event resolved within the assessed base case: localised, multi-node disruption concentrated in KwaZulu-Natal and Gauteng rather than a uniform national shutdown, with the sharpest harm falling on people rather than property. Organisations that followed the published posture — pre-positioned, people-first, with the N3 and N2 treated as red routes — entered the day prepared rather than reactive.
Plan around the base case, but harden against the tail. The value of a risk assessment is measured in what is ready before the event, not in what is explained after it.
The engagement demonstrates the full lifecycle in public view: a national risk assessment with a defensible methodology, provincial risk modelling that told each region what to expect, and a live incident dashboard that carried decision-makers through the event itself. It is the same discipline we build privately for clients — visible, for once, end to end.